

Introduction
Monte Carlo simulations use random sampling to model uncertainty and variability in decision-making. The name originates from the city in Monaco, known for its casinos, symbolizing randomness in probability-based simulations. While randomness may seem counterintuitive for business decisions, it provides a structured way to assess possible outcomes and mitigate risks. By running thousands or even millions of simulations, businesses can make informed choices based on probability distributions rather than single-point estimates.
How Monte Carlo Simulations Work

Monte Carlo simulations generate multiple scenarios by varying input factors within predefined ranges. The process follows these steps:
Define the Problem – Identify key measures (e.g., gross profit) and dimensions (e.g., date, location) for analysis.
Set the Range – Establish possible values for each factor based on historical data or expert judgment.
Random Sampling – Generate random samples within the defined range.
Run Simulations – Perform thousands of iterations to model potential scenarios.
Analyze Results – Assess distributions of possible outcomes and their probabilities.
Decision Making – Use insights to guide business strategies, considering best-, worst-, and likely-case scenarios.
Monte Carlo simulations are particularly useful in scenarios where deterministic models fail to capture the full range of possible outcomes. These simulations help organizations quantify risks and optimize decision-making under uncertainty.
Monte Carlo Simulations in SAP Analytics Cloud Compass
SAP Analytics Cloud (SAC) Compass integrates Monte Carlo simulations into planning, making them accessible to non-technical users. It automates complex calculations and allows users to analyze performance drivers with minimal manual intervention. This integration reduces the reliance on advanced statistical knowledge while still providing robust forecasting capabilities.
Key Features:
Simplified User Experience – Users can estimate probable operating income, cash flow, and other metrics by defining performance driver ranges.
Automation – The tool handles variable detection and calculations, reducing guesswork.
Interactive Visualization – Simulations generate graphical representations of best-case, worst-case, and most likely outcomes.
Scenario Comparison – Users can compare multiple simulations to assess the impact of different assumptions and strategies.
Step-by-Step Guide to Running Monte Carlo Simulations in SAC Compass
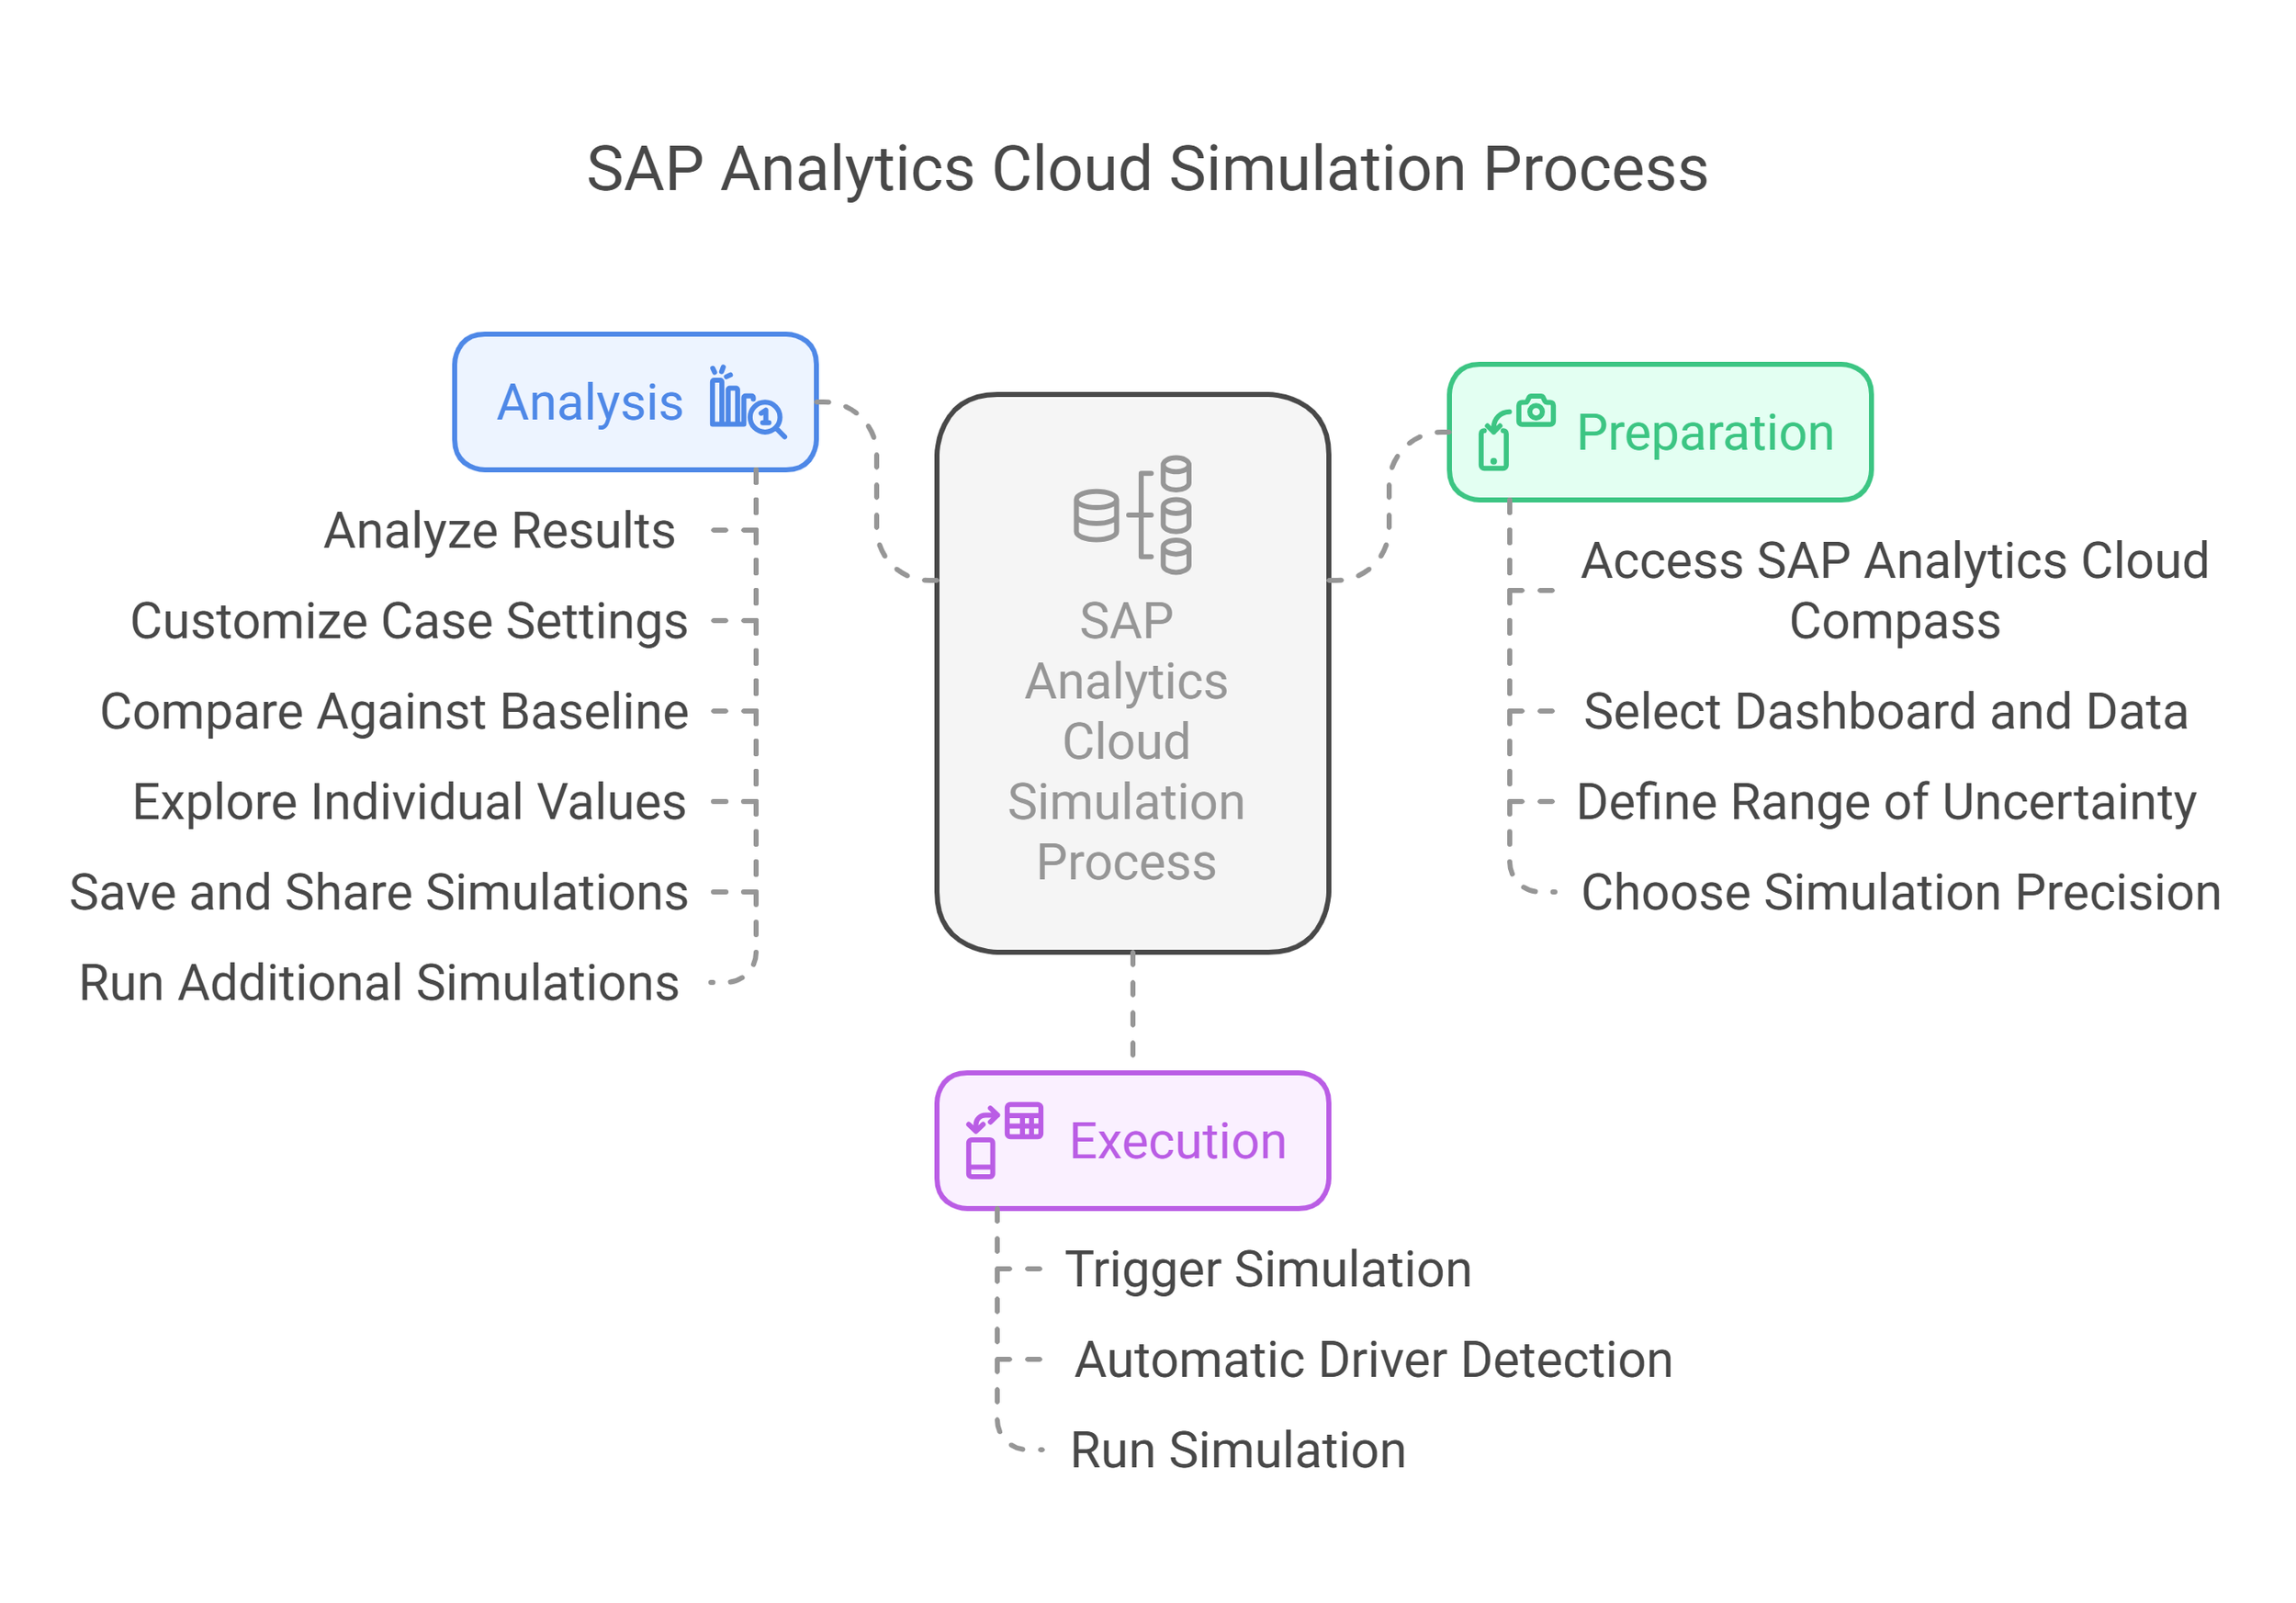
1. Access SAP Analytics Cloud Compass
Launch SAC and initiate a new Compass simulation via the toolbar or from a dashboard.
2. Select the Dashboard and Data
Identify the metrics for analysis, such as revenue, costs, or other key performance indicators.
3. Trigger the Simulation
If planned metrics deviate from expectations, start a Compass simulation from the dashboard.
4. Automatic Driver Detection
SAC automatically detects variables influencing selected metrics. Users can refine the selection to ensure relevant drivers are included in the analysis.
5. Define the Range of Uncertainty
Set upper and lower bounds for selected drivers based on historical trends or expert input. This step ensures realistic scenario modeling and improves the accuracy of risk assessments.
6. Choose Simulation Precision
Select a calculation precision level i.e.:
Medium: 10,000 iterations
High: 100,000 iterations
Higher precision levels provide more refined probability distributions but may require longer computation times.
7. Run the Simulation
SAC generates results using random sampling within defined ranges, providing a probabilistic distribution of outcomes rather than a single projected figure.
8. Analyze the Results
A probability distribution graph displays potential outcomes. Users can assess optimistic, pessimistic, and realistic scenarios. This visualization helps decision-makers identify risk exposure and develop mitigation strategies.
9. Customize Case Settings
Adjust scenario parameters, including name, color, and percentile divisions, to better align with organizational risk thresholds and reporting preferences.
10. Compare Against Baseline
Compare simulated results with planned values to evaluate potential risks and opportunities. This comparison helps determine whether adjustments to strategies are necessary.
11. Explore Individual Values
Interactive tools, such as sliders, allow users to assess the probability of reaching specific targets. This feature enhances dynamic decision-making by providing a range of possible outcomes for each scenario.
12. Save and Share Simulations
Store results for future reference and collaboration. Teams can revisit prior simulations to refine assumptions and improve future forecasting accuracy.
13. Run Additional Simulations
Iterate simulations to compare different scenarios and refine risk analysis. Running multiple simulations enables a more comprehensive understanding of how different variables impact business performance.
Applications and Benefits
Monte Carlo simulations have broad applications across industries, including:
Financial Forecasting – Model income, cash flow, and profitability under varying market conditions. This helps CFOs and financial planners develop more resilient budget strategies.

Workforce Planning – Estimate staffing needs based on turnover and hiring rates. HR teams can use simulations to assess workforce gaps and optimize hiring strategies.
Investment Analysis – Assess risks and returns of different financial strategies. Investors and portfolio managers use Monte Carlo simulations to model potential market fluctuations and optimize asset allocations.
Supply Chain Management – Evaluate the impact of demand variability and logistics disruptions on inventory levels and operational efficiency.
Project Management – Identify potential cost overruns and schedule risks to improve project planning and resource allocation.
By applying Monte Carlo simulations to these areas, businesses can proactively mitigate risks, improve decision-making, and enhance overall operational resilience.
Conclusion
Monte Carlo simulations in SAP Analytics Cloud Compass offer a powerful approach to risk management and predictive analytics. By automating complex calculations and providing intuitive visualizations, SAC enables businesses to create data-driven, risk-adjusted budgets.
Unlike traditional forecasting methods that rely on single-point estimates, Monte Carlo simulations provide a comprehensive view of potential outcomes, allowing organizations to better navigate uncertainty. With minimal expertise required, decision-makers can explore different scenarios, compare risk-adjusted projections, and enhance strategic planning in an increasingly volatile business environment.
By leveraging SAC Compass, businesses can make more informed decisions, optimize financial planning, and build resilience in an ever-changing market landscape.